
Weekly Austin Real Estate Market Update
Austin Real Estate Weekly Market Update - May 15, 2025
by: Dan Price, Broker at Team Price Real Estate
Austin's leading data analysis brokerage, where data drives exceptional service
Published on: Thursday, May 15, 2025 at 12:02 pm
Austin’s Real Estate Market : At Team Price Real Estate, we’re here to guide you through Austin’s real estate market with clarity and confidence. Each week, our Austin-Area MLS report delivers the most current market insights. This week, active listings have climbed to 16,876, and Months of Inventory has increased to 5.99—reflecting a growing supply and a continued market correction. Read our full analysis below to stay informed and make confident decisions. For a deeper dive, explore our comprehensive PDF report—featuring over 800 pages of detailed data—to support your next move in Austin’s market.
Market Overview
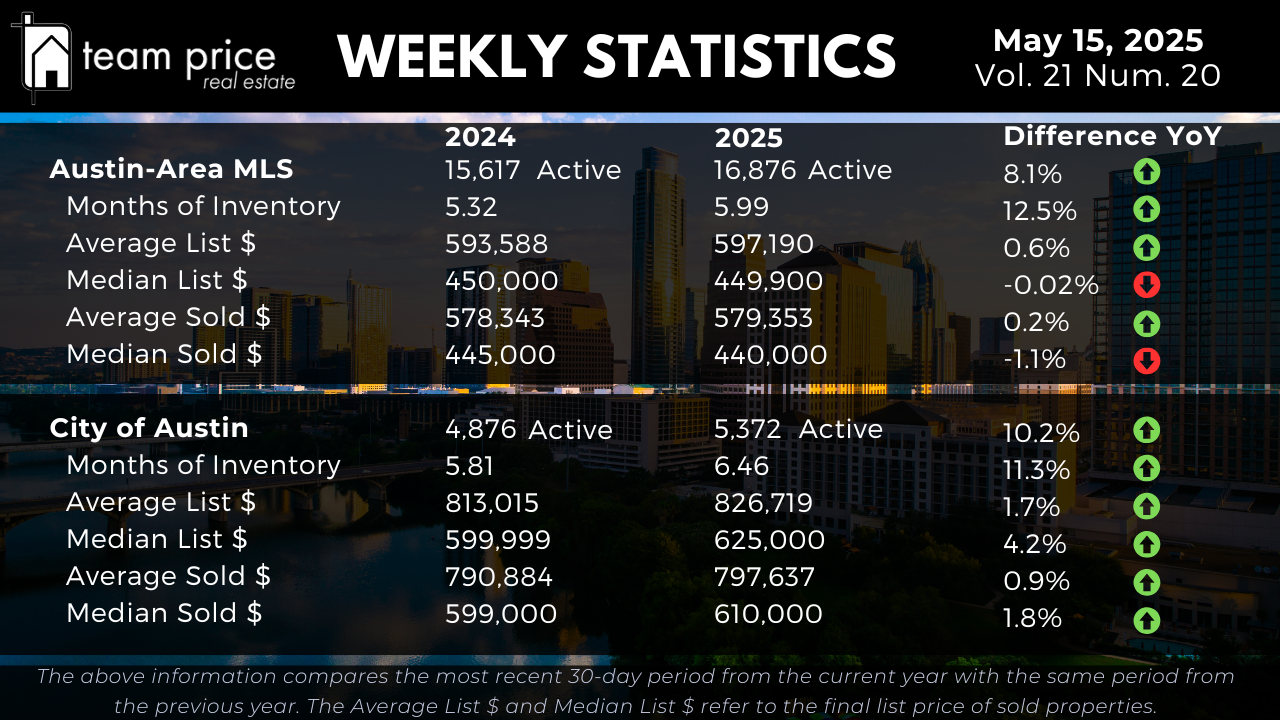
As of May 15, 2025, the Austin-area MLS shows 16,876 active listings, marking an 8.1% increase from 15,617 active listings in May 2024. The Months of Inventory has also risen sharply, reaching 5.99 months, up from 5.32 months a year ago—an increase of 12.5%, or approximately 1.1x. This expansion in inventory suggests continued pressure on pricing and more leverage for buyers. In the City of Austin, inventory climbed from 4,876 to 5,372 active listings, a 10.2% year-over-year increase, with Months of Inventory moving from 5.81 to 6.46 months—also a 1.1x increase. These shifts underscore a broad trend of growing supply and softening demand across both the metro area and city core.
Pricing Dynamics in Austin Real Estate
Price movements across the region remain relatively flat, with minor year-over-year adjustments. In the Austin-area MLS, the average active list price is up 0.6%, rising from $593,588 to $597,190. The average sold price has increased just 0.2%, from $578,343 to $579,353. The median active list price is essentially unchanged at $449,900, down only 0.02% from $450,000. However, the median sold price has declined 1.1%, from $445,000 to $440,000—a signal of pricing pressure in the lower tiers of the market. In the City of Austin, pricing has trended upward. The average active list price has grown 1.7%, from $813,015 to $826,719, while the median active list price rose 4.2%, from $599,999 to $625,000. On the sold side, the average price is up 0.9% to $797,637, and the median sold price has increased 1.8% to $610,000. Overall, while regional prices remain relatively steady, the City of Austin continues to show resilience in key pricing metrics.
City and Regional Dynamics
Across the 30 Central Texas cities monitored by Team Price Real Estate, the market reflects a mixed and highly localized pattern. Half of the cities (15 out of 30) recorded month-over-month price increases, while 14 cities (47%) saw declines. On a year-over-year basis, 12 cities (40%) posted gains, while 18 (60%) experienced price decreases. Notably, none of the 30 cities are priced above their peak values from the past 12 months—100% have declined from their highs. Among the 75 tracked zip codes, 39 (52%) recorded month-over-month price increases, while 33 (44%) declined. Year-over-year, 28 zip codes (37%) saw appreciation, compared to 47 (63%) that posted declines. Only 2 zip codes remain above their 12-month peak prices, while 73 are below. These figures emphasize ongoing market normalization and continued price compression in many areas.
Sales vs. List Price Analysis
As of May 2025, 64.20% of homes sold below list price, a slight uptick from 62.86% last month, and still below the 66.46% seen in April. Meanwhile, 21.50% of properties sold at list price, holding close to April’s 21.91%. A modest 14.30% sold above list price, a small decrease from last month’s 15.22% and noticeably lower than the 16.81% seen in May 2024. The average sold-to-list price ratio now stands at 97.59%, indicating that while buyers are still negotiating, sellers are retaining most of their asking value.
Peak Value Analysis: Austin-Area MLS
The Austin-area MLS remains well below prior market peaks across most pricing benchmarks. The average list price reached a high of $733,290 in April 2025 but has since dropped 7.9% to $674,736. The median list price is down 8.3% from its May 2022 peak of $539,900 to $495,000. The average sold price has declined a modest 0.9% from its May 2022 peak of $664,515 to $658,410, while the median sold price has fallen 9.7%, from $538,000 to $486,000. Price per square foot shows even more pronounced declines. The average price per square foot has dropped 14.2%, from $324 in April 2022 to $278, and the median price per square foot is down 17.1%, from $280 to $232.
Peak Value Analysis: City of Austin
In the City of Austin, the average list price peaked at $975,300 in April 2025 and has since declined 11.2% to $866,386. The median list price also dropped 11.6%, from $677,450 to $599,000. However, the average sold price remains at its all-time high of $895,687 as of May 2025, indicating that high-end sales continue to hold firm. Still, other metrics show downward movement. The median sold price is down 5.5% from its May 2022 peak of $680,000 to $642,500. The average sold price per square foot has dropped 16.3%, from $442 to $370, while the median sold price per square foot is down 13.2%, from $393 to $341. This illustrates that while some price points remain stable, the broader market in Austin is still trading below peak conditions.
